Edit Template
This option will allow the user to modify the template that is used for the selected instrument. Note: The template will vary depending on whether the instrument is a PGA or an MGA. Clicking on this option will display the Edit Template screen.
The Edit Template screen will display all of the existing trends for the template. The name of the trend and a description of the trend will be displayed. The user will be able to add, remove, or modify existing trends.
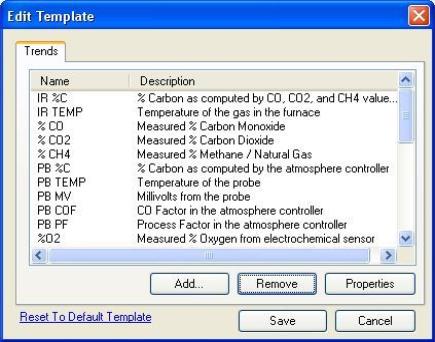
Figure 26 - "Edit Template" window
Add A Trend
Click on the Add… button to add a new trend to the template. The new trend will be displayed at the bottom of the list and the name will be “NEW_TREND” with a description of “New Trend”.
Note: Adding a new trend will simply add the default information. Once the trend is added, the user will have to modify the trend to get the relevant information to display on the chart. See the section Modify A Trend in this section of the manual for more information on how to modify the trend once it is created.
Remove A Trend
To remove a trend from the template’s setup, select the desired trend from the list and click on the Remove button. This will delete the selected trend from the template’s setup.
Modify A Trend
To modify a trend in the template, select the desired trend and then click on the Properties button. This will display the Edit Trend screen with the General tab displayed.
There are four tabs on the Edit Trend screen:
-
General – This tab contains general information about the trend, such as name, description, etc.
-
Formatting – This tab contains information about the formatting of the trend, such as the units, decimal places, etc.
-
Data – This tab contains information about where the data for the trend is coming from.
-
Advanced – This tab contains advanced information, such as using an algebraic expression to format the data.
General Tab:
The “Trend Name” will be the name for the trend. This is how the trend will be identified on the chart, tabular data, and any printed material. The name should be both short and descriptive.
The “Trend Description” will be a brief description of what the trend is. This will be displayed on the Edit Template screen. The description, like the name, should be both short and descriptive of the trend.
The “Enable this trend” checkbox will enable the trend, which means that the SSi XGA Viewer software will begin to display the data logging for that value. Note: All of the variables are logged all of the time, but the user can decide which to display and which to not.
The “This trend may be viewed on the chart” checkbox will allow the trend to be viewed on the chart display.
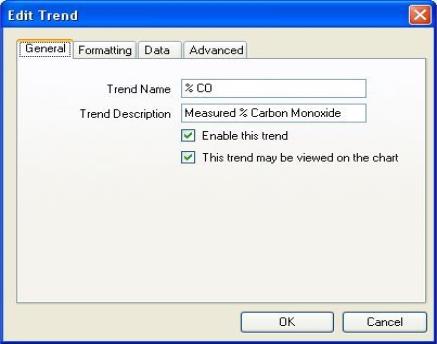
Figure 27 - "Edit Trend" window – General tab
Formatting Tab:
The “Units” will be the display units for the trend. This could be a % for a gas trend, such as %C, or it could be °F or °C for a temperature trend.
The “Decimal Places” will be the number of decimal places to display on the trend. This value can range anywhere from 0 to 4 decimal places displayed.
The “area” section will set up how the trend is displayed on the chart. The “Color” will be the color of the trend line and trend information displayed on the left of the screen. The “Chart Min” will be the minimum value for the range of the chart. The “Chart Max” will be the maximum value for the range of the chart.
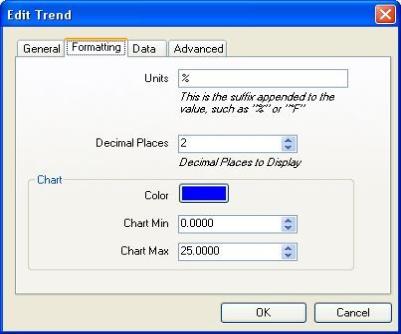
Figure 28 - "Edit Trend" window - Formatting tab
Data Tab:
Note: Each trend value has a specific location in the data log files. Do not modify any of these values without first contacting Super Systems Inc.
The “Channel” will be the specific channel to pull the data from.
The “Slot” will be the specific slot to pull the data from.
The “Decimal Places” will be the number of source decimal places for the logged data.
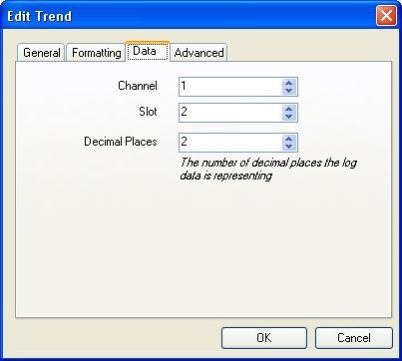
Figure 29 - "Edit Trend" window - Data tab
Advanced Tab:
The “Expression” will be an algebraic expression that can be used to translate the data. Use an “x” to represent the data in the equation. For example, to subtract 100 from the values, use the following expression: “x – 100”. With this example, a value of 1700 °F will be displayed as 1600 °F.
The “Special Values” will display the specified values (“Message”) when the current value (“Data”) is present. A common use for the special values is when the value reaches 0. The “Data” would be 0, and the “Message” would be “----”, which means that whenever that trend had a value of 0, the trend’s display on the left of the screen would display a line of dashes. The “Message” field can contain either numbers or text.
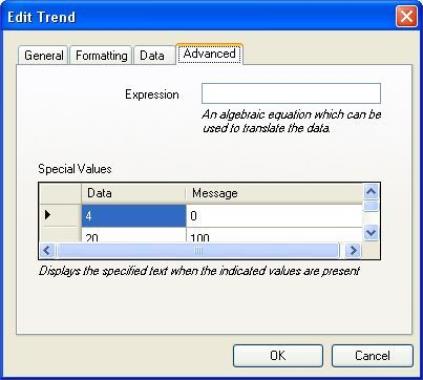
Figure 30 - "Edit Trend" window - Advanced tab