Manually Creating a Survey Record
Clicking on the “Advanced: Manually Create Survey Record” link from the Load Survey Data screen will allow the user to create a survey record to use. Clicking on this link will display the “Manually Create Survey Record” form (figure 2.5). Five pieces of data are required to manually create a record: the SDS model, serial number, the start time and date of the survey, the end time and date of the survey, and the TC Spool Offset.

Figure 2.5 Manually Create Survey Record form
The drop-down list next to “Survey Box Model” contains a list of the available models, the SDS8020 and the SDS8040. Select they model type. Enter the SDS serial number on the next line, “Survey Box Serial Number”. The SDS model and serial number can be found on the About / Sign-on menu, menu option 12 on the SDS instrument. The process for selecting the start date/time and the end date/time is the same. To select a date, click on the down arrow next to the time listed. This will bring up a calendar from which the user can select a new date (figure 2.6). Select the new date by clicking on it.
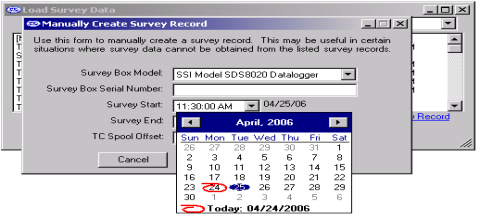
Figure 2.6 Select new date
The date of the survey start /end is listed to the right of the drop-down list. To select a time, click on the hours, minutes, seconds or “AM/PM”. The selected field will be highlighted. Each field can be changed by using the up or down arrows on the keyboard. If the survey start date is later than the survey end date, a message will be displayed to the user and the record will not be added (figure 2.7).

Figure 2.7 Survey start/end date error message
Enter the TC spool offset and click on the “Add Record” button to add the record. Clicking on the “Cancel” button will cancel the add process and bring the user back to the “Load Survey Data” dialog box. If the add was successful, a message box will be displayed (figure 2.8).
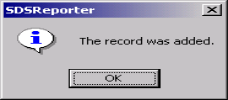
Figure 2.8 Record Add successful message
The added record will be displayed chronologically in the top of the list. Any record manually added will begin with “[Manual Entry]” (figure 2.9). If the manually created survey is less than one second, it will not be displayed in the list.

Figure 2.9 Manual entry on Load Survey Data form
Note – Most of the “Report Properties” tabs (Report, Furnace, Survey Box) will need to be filled out manually as well.
The next tab is the Thermocouples tab (figure 2.10). This tab contains the information about the thermocouple settings and it also lists the active thermocouples. The information in the thermocouple settings includes: the temperature type (F or C), the number of thermocouples, the number of TCs used in the report, the thermocouple type, the thermocouple gauge, the thermocouple spool number, whom the thermocouple was calibrated by, the date the thermocouple was calibrated, and the thermocouple spool correction factor. Clicking on the “Change” button will allow the user to change the spool correction (figure 2.11).
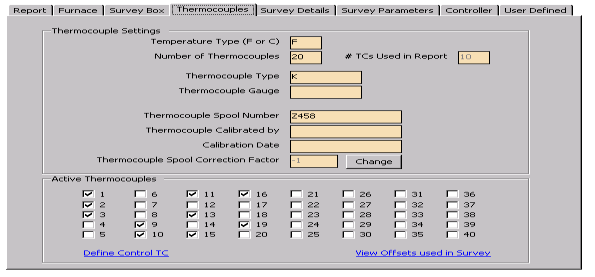
Figure 2.10 Report Properties Thermocouples Tab

Figure 2.11 Spool Correction screen
All values displayed to the users are corrected. That means if there is a defined offset for the TC Spool and a channel offset, the user would be shown the net result of those offsets into the value displayed.
There are checkboxes for a possible forty thermocouples, but only the active thermocouples will have checks in the checkboxes. Clicking on the “Define Control TC” link will allow the user to select the TC or TCs that will be the control TC(s) (figure 2.12). The operator can select any of the thermocouples to be the control TC(s) and provide an optional description for that TC.
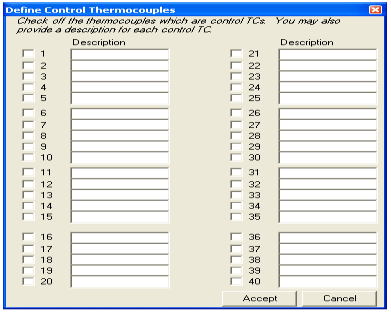
Figure 2.12 Define Control TC screen
Clicking on the Accept button will set the selected control TC(s). Once a control TC(s) has been selected, the TC’s number will be in Red on the “Active Thermocouples” section of the Thermocouples tab. The thermocouple(s) that is identified as the control TC will not be used for the TC summary when identifying hottest and coldest channels.
Clicking on the “View Offsets used in Survey” link will display a list of the offsets that were used on the survey (figure 2.13). All values that are displayed to the users are corrected values. That means the Offset defined for these TCs have already been incorporated into the value the operator would see. IF there is a value for the TC Spool Correction Factor, that value will also be incorporated providing a corrected view for the user.
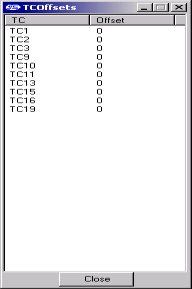
Figure 2.13 TCOffsets screen
Note: Checking or unchecking TCs on the Thermocouples Tab will affect the TCs plotted on the Chart Tab.
The next tab is the Furnace tab (figure 2.14a and 2.14b), which contains the furnace ID, the make and model of the furnace, the furnace type, the furnace use, the furnace’s operating range, the furnace dimensions, the furnace class (newer versions only), and an optional image of the furnace.
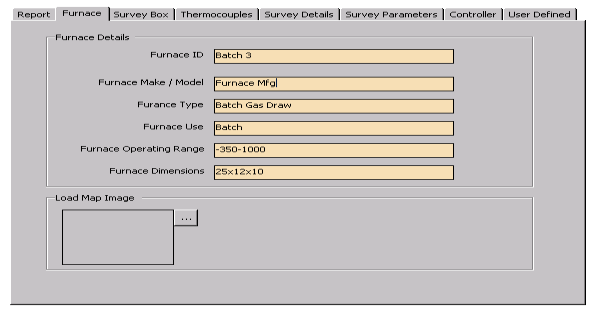
Figure 2.14a Report Properties Furnace Tab (Version 1.101.0.76 & below)
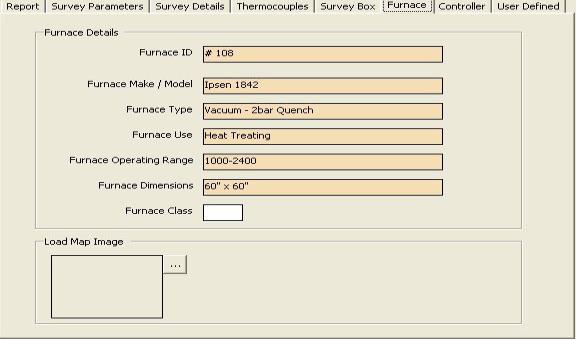
Figure 2.14b Report Properties Furnace Tab (Version 1.101.0.80 & above)
Clicking on the open box next the image frame will open a dialog box where the user can search for an image of the furnace to use.
The next tab is the Survey Box tab, which contains information about the survey box itself, such as the make and model, the serial number, whom the survey box was calibrated by, and the calibration date (figure 2.15).
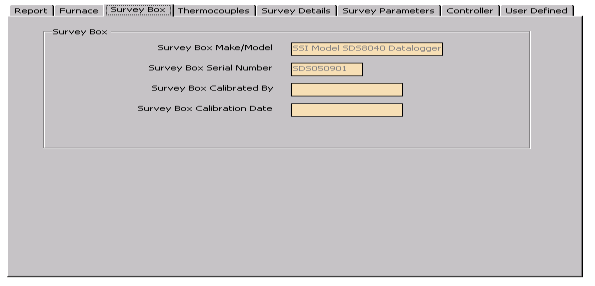
Figure 2.15 Report Properties Survey Box Tab
The next tab is the Survey Details Tab (figure 2.16). The Survey Details tab contains the company name, the survey start date, the survey duration, the actual duration of the survey, the survey specifcation(s), whom the survey was performed by, whom the survey was approved by, the date range for the survey, and the due date of the next survey.
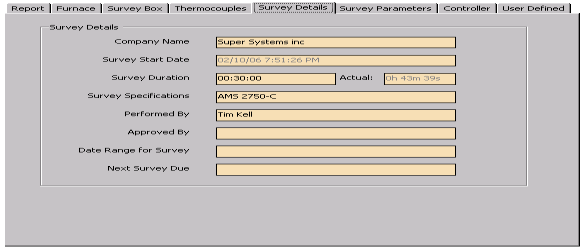
Figure 2.16 Report Properties Survey Details Tab
The next tab is the Survey Parameters Tab (figure 2.17). The Survey Parameters tab contains: the survey tolerance, the survey setpoint, the overtemp setpoint, the simulated load in pounds, and the microns.
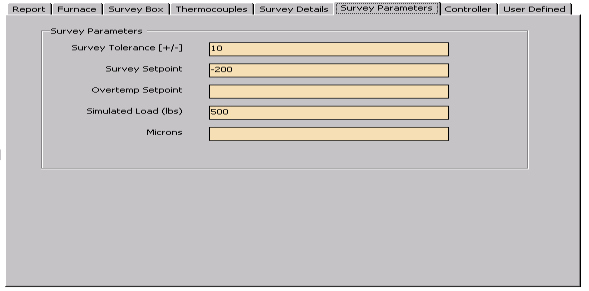
Figure 2.17 Report Properties Survey Parameters Tab
The next tab is the Controller Tab (figure 2.18a and 2.18b). This tab contains the Controller manufacturer, the controller model, and the instrument type (newer versions only) in the “Temperature Controller Settings” area and this tab also contains the PID Settings: cycle time, dead band, output limit, PB (Gain), rate, and reset.
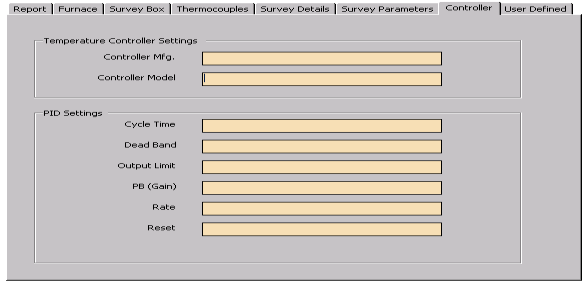
Figure 2.18a Report Properties Controller Tab (Version 1.101.0.76 & below)
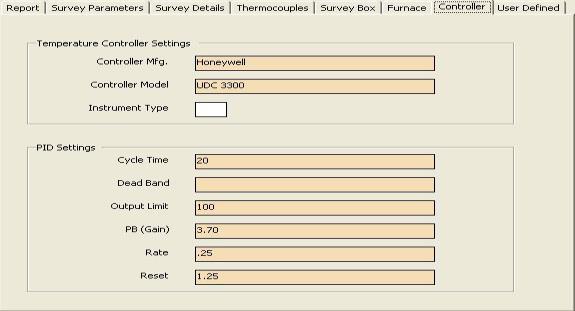
Figure 2.18b Report Properties Controller Tab (Version 1.101.0.80 & above)
The last tab in the Report Properties tab is the User Defined Tab (figure 2.19a and 2.19b). This tab contains ten (version 1.101.0.76 & below) or twenty (version 1.101.0.80 & above) fields that can be defined by the user and included in the report.

Figure 2.19a Report Properties User Defined Tab (Version 1.101.0.76 & below)
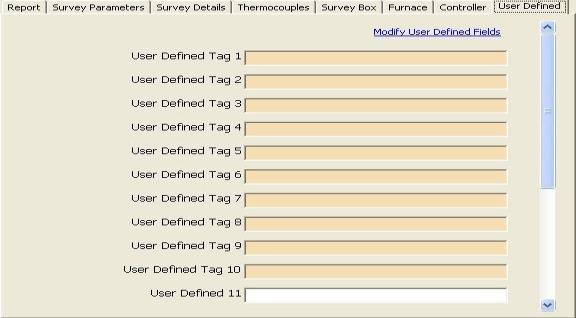
Figure 2.19b Report Properties User Defined Tab (Version 1.101.0.80 & above)
To create a user defined field, click on the “Modify User Defined Fields”. This will display a screen that will allow the user to edit the fields (figure 2.20). The user can type in the name or description of the field and click the “Save” button.
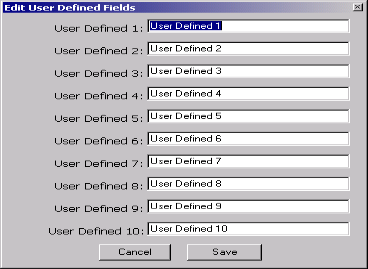
Figure 2.20 Edit User Defined Fields screen
SDS à View Real-time Data.”
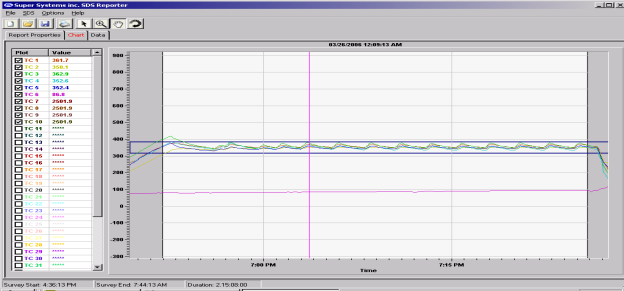
Figure 2.21 Chart Tab
Note: checking or unchecking TCs on the Chart Tab will affect the Active TCs on the Report Properties – Thermocouples tab.
The Data Tab (figure 2.23) contains the data from each thermocouple for the each interval selected from the Load Survey Data screen (figure 2.4).
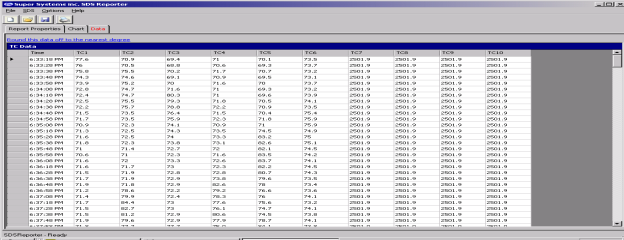
Figure 2.23 Data Tab
Clicking on the “Round this data off to the nearest degree” link will pop up a message box confirming the action (figure 2.24). The rounding only affects imported data. The data in the logged files will still contain data rounded to one decimal place. Clicking on the “Yes” button will round the data.

Figure 2.24 Round data confirmation