Touch Screen Interface
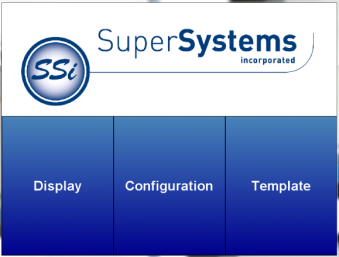
The DR Series recorder is equipped with a touch screen operator interface, which is used to view the different variables that are being recorded. When the screen is powered up with the 24 VDC supply and connected to the DR series analog input base module, the Main screen appears.

The three options available are Display, Configuration, and Template. Clicking on the Display option will load the chart.
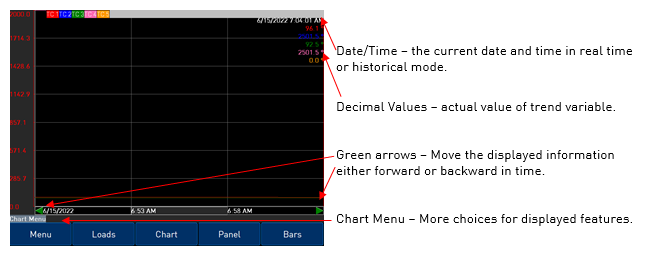
On the Display screen, there are several variables displayed.

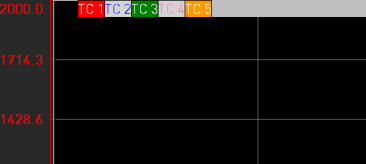
The inputs that appear on the chart can be toggled between being displayed or being left off simply by tapping on the name of the input along the top of the chart. The box with the input number will turn gray.
In this example, TC2 and TC4 have been deselected:

Selecting the Chart Menu provides more options for the display.
Realtime – Choosing this option sets the displayed values to the present date and time.
Zoom – This selection allows you to move your stylus or finger on the screen to a specific point creating a box. The zoom box will also display decimal values for the low and high variables inside the box. It will display the start and end time for the zoom box itself. The zoom feature can be used as often as desired allowing the user to drill down on the variable to show a specific value displayed on the screen.
Note – the Note feature available on DR series recorders allows the operator to add notes in the chart display. Notes can be added using either a stylus or the keyboard displayed on the screen. Choose the Add Note option from the Chart Menu then select keyboard or stylus to add a note. Note on keyboard functionality – pressing the “caps” button or the “shift” button will display more keys for data entry. Also, the “del” key works more like the “Backspace” key on a regular keyboard – i.e. it will delete the character to the left of the cursor.
If a note requires editing, select clear to retype or scribe the note or cancel to go back to the chart display.
The note is displayed on the chart menu with a small icon. If the icon is touched it will expand to show the information either scribed or typed onto the recorder.
Jump – This option allows the user to input the date and time to be displayed. The chart will jump to this time.
Statistics – The statistics option is also available on the chart menu. Choosing this option allows the operator to view statistics on any variable displayed on the operator interface. The statistics are based on the screen image displayed whether looking at seven days of data or zoomed in on a few minutes.
The statistics parameters include the trend name, the number of data points available for calculating statistics, the Minimum value, the Maximum value, the Average value, and the standard deviation.
Sample – Pre selected time frame formats change the displayed values on the screen to this duration.
Note: When the sample rate is “15 minutes @ 1 sec”, the averagers will not be displayed on the trend chart.
Template Rotation – This option enables the display to cycle through the different templates that have been saved.
Selecting Rotation Settings brings up a list of available options for the display settings. Checking the Use Main Template box will keep the display on one template. Select Main Template allows the user to decide which template to display permanently if Use Main Template is chosen. Checking the Use Rotation Settings box will enable the templates to cycle. The templates to be displayed can be customized by checking or unchecking the box next to each name under Select Rotation Templates. The amount of time each template is displayed can be adjusted using the Rotation Settings button.
Along the bottom of the Display screen, there are other options for the way the template information is presented.
The Loads button helps keep track of Active and Historical load data.
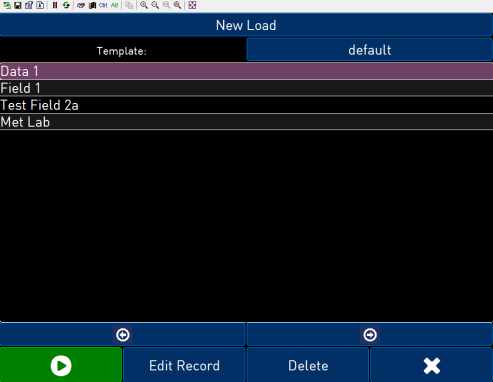
Pressing + will bring up the screen for a New Load.

To change the displayed Template, tap the button with the current template name (in the above example, “default”). Then tap the desired template to highlight and tap
 to select or
 to cancel. The template options can be edited in the Template Edit section.
Use the
 and
and  buttons to select the numbered instance of Data. Each can then be assigned the information set in the template (see Template Edit). In the above example, this would be Field 1, Test Field 2a, and Met Lab. To name these fields, tap to highlight, then tap “Edit Record.” Enter the information using the on-screen keyboard, and tap “enter” to save or “Esc” to leave without saving.
Tapping “Delete” will delete the displayed information.
Tap
 to start the load.
Tap
 to return to the Loads screen.
For information on a current load, tap it in the list to highlight, then tap

Use the
 and
and  buttons to scroll forward and backward. Tap “End Load” to end the load, or
  to return to the Loads screen.
By pressing the
 button on the loads screen, the historical load data will be displayed. Use the date/time buttons at the top of the screen to set a start and end date to display.
The
 button will display the information that has been stored about each load. The Search key allows all historical load data to be searched according to the template fields, or within the Notes. Only notes that have been entered with the keypad can be searched. Notes written the stylus will not be included in searches.
To search historical loads, press the Search key.
Highlight the appropriate field and tap
 . A keypad will display. Press enter on the keypad to save information, delete to backspace a letter, and esc to leave the keypad without saving changes. Once the search key(s) have been entered, press the Search button, and a list of matching results will be displayed.
To view information on a load, tap it to highlight, then tap
 or “Chart.”
When finished, tap
 to return to the Loads screen.
The data on the main screen can also be displayed in a panel or bar format.
To select the panel view, view touch the Panel button on the bottom of the screen. In this mode, decimal values chosen for this template are displayed. Only realtime data can be displayed in the panel view. It is also possible to send a setpoint down to a Client instrument. The Client instrument’s setpoint must be included as a trend line. From the panel view screen, touch the Client instrument’s setpoint panel and a menu will pop up that will allow the user to send the setpoint down to the instrument. Select this option and enter the new setpoint.
A third choice for viewing variables on the DR operator interface is the Bars view. To select this view touch the Bars button on the bottom of the screen. In this mode, the decimal values chosen for this template are displayed as well as a vertical bar chart for each variable with the appropriate scaling for each. Only realtime data can be displayed in the Bars view.