Manually Creating a Survey Record
Clicking on the “Advanced: Manually Create Survey Record” link from the Load Survey Data screen will allow the user to create a survey record to use. Clicking on this link will display the “Manually Create Survey Record” form (Figure 60 - Manually Create Survey Record form). Five pieces of data are required to manually create a record: the SDS model, serial number, the start time and date of the survey, the end time and date of the survey, and the TC Spool Offset. All data will need to be downloaded from the SDS either before or after this process in order to get data. To download all data, please refer to section SDS à Download Surveys and Dataà.
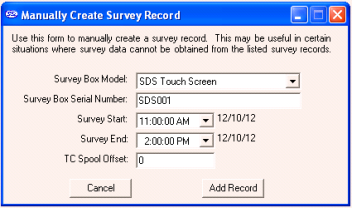
Figure 60 - Manually Create Survey Record form
The drop-down list next to “Survey Box Model” contains a list of the available models. Make sure to select the appropriate Color SDS Data Logger. Select the model type (the Color SDS Data Logger is referred to as “SDS Touch Screen”). Enter the SDS serial number on the next line, “Survey Box Serial Number”. The serial number can be found in the About window, as discussed in the About section. The process for selecting the start date/time and the end date/time is the same. To select a date, click on the down arrow next to the time listed. This will bring up a calendar from which the user can select a new date (Figure 61 - Select new date). Select the new date by clicking on it.
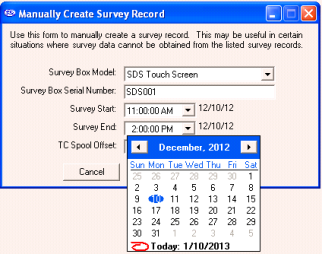
The date of the survey start /end is listed to the right of the drop-down list. To select a time, click on the hours, minutes, seconds or “AM/PM”. The selected field will be highlighted. Each field can be changed by using the up or down arrows on the keyboard. If the survey start date is later than the survey end date, a message will be displayed to the user and the record will not be added (Figure 62 - Survey start/end date error message).

Figure 62 - Survey start/end date error message
Enter the TC spool offset and click on the “Add Record” button to add the record. Clicking on the “Cancel” button will cancel the add process and bring the user back to the “Load Survey Data” dialog box. If the add was successful, a message box will be displayed (Figure 63 - Record Add successful message).
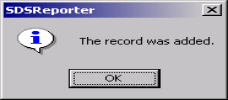
Figure 63 - Record Add successful message
The added record will be displayed chronologically in the top of the list. Any record manually added will begin with “[Manual Entry]” (Figure 64 - Manual entry on Load Survey Data form). If the manually created survey is less than one second, it will not be displayed in the list.

Figure 64 - Manual entry on Load Survey Data form
NOTE: Most of the “Report Properties” tabs (Report, Furnace, Survey Box) will need to be filled out manually as well.
The next tab is the Thermocouples tab (Figure 65 - Report Properties Thermocouples Tab). This tab contains the information about the thermocouple settings and it also lists the active thermocouples. The information in the thermocouple settings includes: the temperature type (F or C), the number of thermocouples, the number of TCs used in the report, the thermocouple type, the thermocouple gauge, the thermocouple spool number, whom the thermocouple was calibrated by, the date the thermocouple was calibrated, and the thermocouple spool correction factor. Clicking on the “Change” button will allow the user to change the spool correction (Figure 66 - Spool Correction screen).
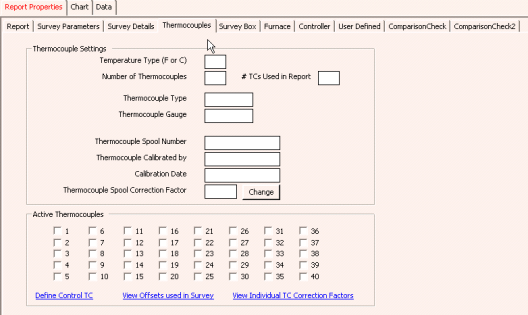
Figure 65 - Report Properties Thermocouples Tab

Figure 66 - Spool Correction screen
All values displayed to the users are corrected. That means if there is a defined offset for the TC Spool and a channel offset, the user would be shown the net result of those offsets into the value displayed.
There are checkboxes for a possible forty thermocouples, but only the active thermocouples will have checks in the checkboxes. Clicking on the “Define Control TC” link will allow the user to select the TC or TCs that will be the control TC(s) (Figure 67 - Define Control TC screen). The operator can select any of the thermocouples to be the control TC(s) and provide an optional description for that TC.
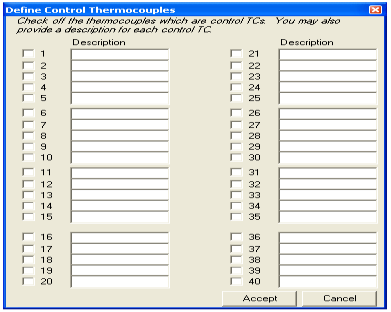
Figure 67 - Define Control TC screen
Clicking on the Accept button will set the selected control TC(s). Once a control TC(s) has been selected, the TC’s number will be in Red on the “Active Thermocouples” section of the Thermocouples tab. The thermocouple(s) that is identified as the control TC will not be used for the TC summary when identifying hottest and coldest channels.
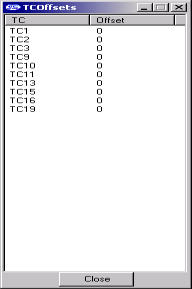
Clicking on the “View Offsets used in Survey” link will display a list of the offsets that were used on the survey (Figure 68 - TCOffsets screen). All values that are displayed to the users are corrected values. That means the Offset defined for these TCs have already been incorporated into the value the operator would see. IF there is a value for the TC Spool Correction Factor, that value will also be incorporated providing a corrected view for the user.
Note: Checking or unchecking TCs on the Thermocouples Tab will affect the TCs plotted on the Chart Tab.
The Thermocouples tab also includes an option to view and edit individual TC correction factors (see Figure 69 - Viewing and Editing Individual TC Correction Factors). Once these correction factors are in place, they will be applied to TC values from survey data. These corrections will be reflected in the report generated by SDS Reporter.
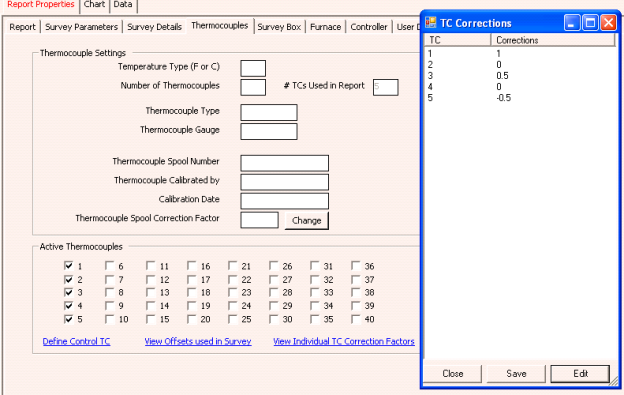
Figure 69 - Viewing and Editing Individual TC Correction Factors
The TC correction factors are passcode protected in the SDSReporter.ini file contained in the SDS Reporter installation folder (typically, the “C:\SSi\SDS” folder). The default passcode is 2. To change it, open the SDSReporter.ini file and add this line in the [SETTINGS] block of the .ini file:
PASSCODE=x
Where x is zero or a positive integer.
The next tab is the Furnace tab (Figure 70 - Report Properties Furnace Tab), which contains the furnace ID, the make and model of the furnace, the furnace type, the furnace use, the furnace’s operating range, the furnace dimensions, the furnace class (newer versions only), and an optional image of the furnace.
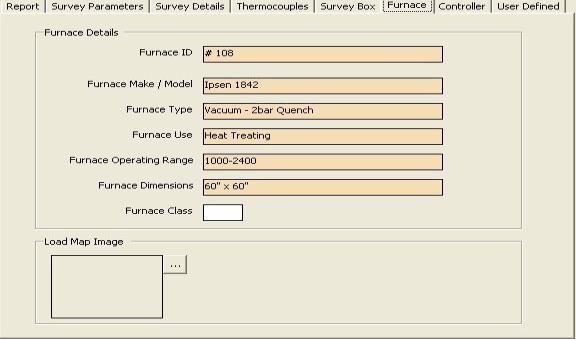
Figure 70 - Report Properties Furnace Tab
Clicking on the open box next the image frame will open a dialog box where the user can search for an image of the furnace to use.
The next tab is the Survey Box tab, which contains information about the survey box itself, such as the make and model, the serial number, whom the survey box was calibrated by, and the calibration date (Figure 71 - Report Properties Survey Box Tab).
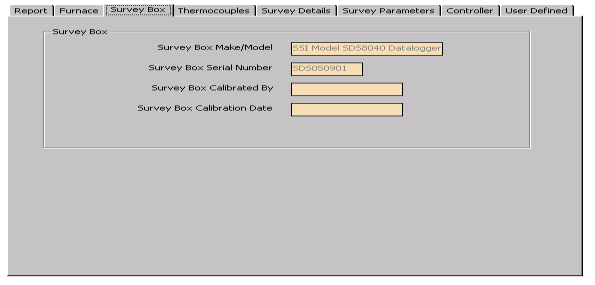
Figure 71 - Report Properties Survey Box Tab
The next tab is the Survey Details Tab (Figure 72 – Report Properties Survey Details Tab). The Survey Details tab contains the company name, the survey start date, the survey duration, the actual duration of the survey, the survey specification(s), whom the survey was performed by, whom the survey was approved by, the date range for the survey, and the due date of the next survey.
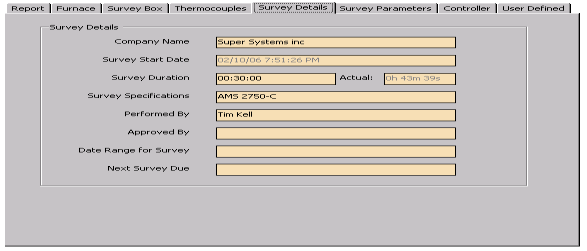
Figure 72 – Report Properties Survey Details Tab
The next tab is the Survey Parameters Tab (Figure 73 - Report Properties Survey Parameters Tab). The Survey Parameters tab contains: the survey tolerance, the survey setpoint, the overtemp setpoint, the simulated load in pounds, and the microns.
The Cooling/Heating combo box affects tags:
-
<SDS:OV>
-
<SDS:OD>
-
<SDS:OVT>
Heating is default. If Cooling is selected, values below the tolerance range are thought to be overshot instead of above the tolerance range (as they are thought to be for Heating).
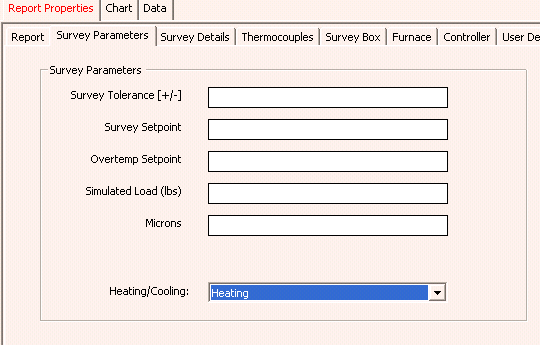
Figure 73 - Report Properties Survey Parameters Tab
The next tab is the Controller Tab (Figure 74 - Report Properties Controller Tab ). This tab contains the Controller manufacturer, the controller model, and the instrument type (newer versions only) in the “Temperature Controller Settings” area and this tab also contains the PID Settings: cycle time, dead band, output limit, PB (Gain), rate, and reset.
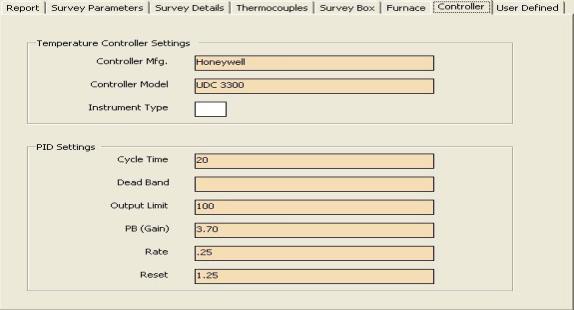
Figure 74 - Report Properties Controller Tab
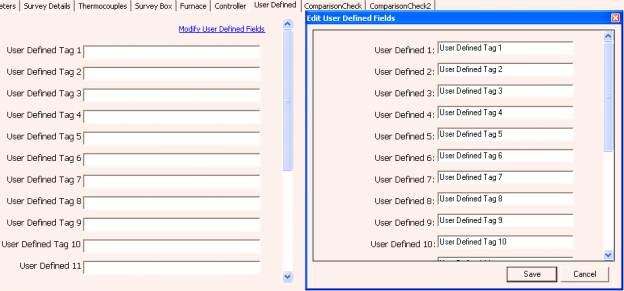
The User Defined tab contains twenty fields that can be defined by the user and included in the report. To create a user defined field, click on the “Modify User Defined Fields”. This will display a screen that will allow the user to edit the fields (Figure 75 - User Defined Fields screen). The user can type in the name or description of the field and click the “Save” button.
