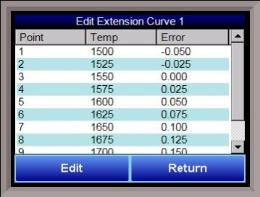
NOTE: Curves are interpolated between points in order to provide a smooth transition between those points. For example:
|
Point |
Temp |
Error |
|
1 |
100 |
0 |
|
2 |
300 |
2 |
In the above setup, temperatures would read as follows:
|
Actual Temperature |
Displayed Temperature |
|
100 |
100 |
|
150 |
150.5 |
|
200 |
201 |
|
250 |
251.5 |
|
300 |
302 |